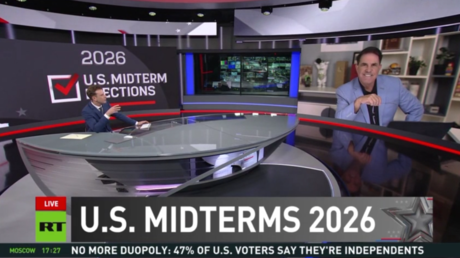
Election polls are driving everyone crazy again. Every night, cable news networks flash bright graphics showing candidate leads within a two-point margin, framing the 2026 midterms as a high-stakes razor-thin contest. Yet behind closed doors, veteran pollsters and political strategists are quietly warning anyone who will listen: take these numbers with a massive grain of salt.
If you feel like polling numbers make less sense each election cycle, you're not imagining things. The polling industry is experiencing structural pressures that make gathering reliable voter data harder than ever before. Between plummeting phone response rates, flawed turnout assumptions, partisan survey spam, and outright hoaxes, reading raw polling averages without context is a recipe for total confusion.
Here is what is actually going wrong inside election polling in 2026 and how you can spot the signal through all the noise.
The Response Rate Collapse Nobody Wants to Talk About
Thirty years ago, pollsters could call a random sample of landline phones and get roughly 60% to 70% of people to answer and complete a survey. Today, that response rate has plummeted below 1% for most phone-based surveys.
Think about what that actually means. If a polling firm needs 1,000 completed responses to publish a survey, they have to dial more than 100,000 phone numbers. The tiny sliver of people who actually pick up a call from an unknown number, agree to stay on the line, and answer 15 minutes of political questions do not represent normal voters. They are disproportionately older, politically hyper-engaged, or bored.
To fix this massive self-selection bias, pollsters use complex mathematical weighting. They adjust the raw numbers so their final sample matches the demographic makeup of the electorate—adjusting for age, race, gender, education, and past voting history. But weighting is an art as much as a science. If a pollster makes slightly flawed assumptions about who turns out to vote, the final weighted result will be completely wrong, even if the raw math looks clean.
┌─────────────────────────────────────────────────────────┐
│              THE RESPONSE RATE CRISIS                   │
├─────────────────────────────────────────────────────────┤
│ 1990s: ~60%-70% completion rate                         │
│ 2026:  <1% completion rate                              │
│                                                         │
│ Result: Pollsters dial 100,000+ numbers to get 1,000    │
│ respondents, creating massive self-selection bias.      │
└─────────────────────────────────────────────────────────┘
The Non-Response Bias Dilemma
The biggest headache for modern survey takers isn't reaching people—it's who refuses to talk to them.
Veteran Republican pollster Frank Luntz pointed out this exact vulnerability ahead of the midterms, warning that conservative voters systematically avoid participating in mainstream political surveys. When a specific segment of the population loses trust in media and polling institutions, they simply hang up.
When one group systematically opts out of surveys, pollsters struggle to capture them. Even if you weight by party registration or past vote, the Republicans or independent voters who do answer your survey often hold different views or enthusiasm levels than the ones who refuse to answer. That differential non-response was a primary culprit behind polling misses in recent presidential and Senate cycles, and it remains a massive wildcard across competitive 2026 battlegrounds.
Low-Quality Polls and Hoaxes are Poisoning the Averages
Not all polls are created equal, yet aggregate models and news headlines often treat them like they are.
In late October 2026, the political world was rocked when a entity called Wedgewood Polls admitted its election data was completely fabricated—claiming it conducted a "social experiment" to see if media outlets and aggregators would blindly publish fake numbers. The trick worked. Outlets swallowed the numbers whole without checking the methodology or verifying the firm's track record.
Beyond outright fakes, the market is flooded with low-quality, partisan-funded surveys. Campaigns and partisan groups routinely drop internal surveys into the public sphere right before an election. Their goal isn't neutral measurement; it's driving media narratives, boosting donor enthusiasm, or creating a sense of momentum. When aggregators dump these low-tier surveys into their daily averages alongside rigorous non-partisan polls, it warps the overall picture.
Turnout Models Are Making Educated Guesses
A poll is a snapshot of opinion among a specific group of people at a single moment. But an election poll has to predict something far harder: who will actually show up to cast a ballot days or weeks later.
Predicting turnout in a midterm election is notoriously difficult. Without a presidential race at the top of the ticket, turnout fluctuates wildly depending on local candidate quality, ballot measures, weather, and enthusiasm gaps.
As Brent Buchanan, CEO of polling firm Cygnal, noted recently, media outlets rarely scroll down to the bottom of a survey report to check whether the demographic and turnout assumptions even make sense for that specific district or state. A survey showing a 5-point lead for a candidate might assume a 55% female turnout in a district that historically votes 51% female. Small shifts in modeled turnout completely change the headline margin.
How to Read Election Polls Like a Professional Analyst
You don't need to ignore polling entirely, but you do need to stop reacting to every single headline. If you want to make sense of election numbers, follow these ground rules:
- Ignore single-poll surprises. Never draw conclusions from an isolated survey showing a sudden 8-point spike. Look only at aggregated trends across multiple independent polling firms over a multi-week period.
- Treat margins of error as absolute minimums. A stated margin of error of +/- 3.5% only accounts for statistical sampling error. Once you factor in non-response bias and turnout modeling errors, the real-world margin of error is usually closer to +/- 6 or 7 points. If a race is 49% to 47%, it is a coin toss.
- Check the pollster's methodology and track record. Look at whether the survey interviewed registered voters or likely voters, and whether it used mixed methods (live callers, text-to-web, online panels) rather than relying on a single outreach channel.
- Focus on candidate fundamentals over horserace leads. Generic ballot measures, presidential approval ratings, consumer confidence metrics, and historical midterm party dynamics often tell you more about the electoral environment than a tight candidate-versus-candidate poll.
Stop panicking over daily polling shifts. Polls are measurement tools with inherent margin boundaries, not crystal balls. Treat them as rough guidelines, look for broad multi-poll trends, and remember that turnouts on election day—not surveys—decide the outcome.